Send email to [email protected] to get the assignments in the doc form on your email
असाइनमेंट्स के लिए कॉल करे 8400000606 या e-mail करें [email protected]
BY SIR MAHAVEER SINGH BHARDWAJ
MB0040 STATISTICS FOR MANAGEMENT
Clasification VS Tabulation
Both classification and tabulation are methods of summarizing data in statistics, which makes further analysis of data to draw inferences from the data. In this article, we will discuss in detail the two methods of summarizing the data and distinguish between classification and tabulation of data.
What is Classification of Data?
In statistics, classification is the process of separation of data into several classes or groups using properties in the data set. For example, the mathematics test results of a class can be separated into two groups using gender. Such a classification condenses the raw data into suitable forms for statistical analysis and removes complex data patterns and highlights the core representatives of the raw data. After classification, comparisons can be made, and inferences can be drawn. Classified data can also provide relationships or correlative data patterns.
Raw data are classified using four key characteristics, such as geographical, chronological, qualitative, and quantitative properties. Consider a data set gathered for analysis of income of workers around the world. For example, the income of an average worker can be classified based on the country of the worker, where geographic factor is the metric for classification. It can also be classified based on the chronological properties such as age of the worker. The profession of each worker also provides a qualitative base for classification and the salary ranges can be used as a quantitative base for classification.
What is Tabulation of Data?
In statistics, tabulation is a method of summarizing data, using a systematic arrangement of data into rows and columns. Tabulation is carried out with the intention of carrying out investigation, for comparison, to identify errors and omissions in data, to study a prevailing trend, to simplify the raw data, to use the space economically and use it as future reference.
Generally a statistical table has following components.
Component
Description
What is the difference between Classification and Tabulation?
• In classification, data are separated and grouped based on a property of the data common to all values.
• In tabulation, data is arranged into columns and rows based on characteristics/properties, or indicators.
• Tabulation often emphasize on the presentation aspects of the data, while classification is used as a means of sorting of data for further analysis.
2 a) Describe the characteristics of Normal probability distribution.
The Normal Probability Distribution is very common in the field of statistics.
Whenever you measure things like people’s height, weight, salary, opinions or votes, the graph of the results is very often a normal curve.
The Normal Distribution
A random variable X whose distribution has the shape of a normal curve is called a normal random variable.
Question: In a sample of 120 workers in a factory, the mean and standard deviation of wages were Rs11.35 and Rs.3.03 respectively. Find the percentage of workers getting wages between Rs.9 and Rs.17 in the whole factory assuming that the wages are normally distributed
Answer :n = 120
μ = 11.35
σ = 3.03
percentage of workers getting wages between Rs.9 and Rs.17 in the whole factory assuming that the wages are normally distributed is :
= P( 9 ≤ X ≤ 17)
= P( [ 9 - μ ] / σ ≤ [X - μ] / σ ≤ [ 17 - μ ] / σ )
= P( [ 9-11.35 ] / 3.03 ≤ z ≤ [ 17-11.35 ] / 3.03 ) ; z = [X - μ ] / σ is the standard normal variable
= P(-0.776 ≤ z ≤ 1.865 )
= P(z ≤ 1.865 ) - P( z ≤ -0.776 )
= 0.96891 - 0.21887
= 0.75
= 75%(Ans)
3 a) The procedure of testing hypothesis requires a researcher to adopt several steps.
Describe in brief all such steps.
Answer : Five Steps of Hypothesis Testing
The basic logic of hypothesis testing is to prove or disprove the research question. By only allowing an error of 5% or 1% and making correct decisions based on statistical principles, the researcher can conclude that the result must be real if chance alone could produce the same result only 5% of the time or less. These five steps consists of
b) Distinguish between:
i. Stratified random sampling and Systematic sampling
Answer : Stratified Random Sampling
Stratified Random Sampling, also sometimes called proportional or quota random sampling, involves dividing your population into homogeneous subgroups and then taking a simple random sample in each subgroup. In more formal terms:
Objective: Divide the population into non-overlapping groups (i.e., strata) N1, N2, N3, … Ni, such that N1 + N2 + N3 + … + Ni = N. Then do a
ii. Judgement sampling and Convenience sampling
Answer : Judgmental sampling is a non-probability sampling technique where the researcher selects units to be sampled based on their knowledge and professional judgment.
Purposive sampling is used in cases where the specialty of an authority can select a more representative sample that can bring more
4 a) What is regression analysis? How does it differ from correlation analysis?
Regression and correlation analysis:
Regression analysis involves identifying the relationship between a dependent variable and one or more independent variables. A model of the relationship is hypothesized, and estimates of the parameter values are used to develop an estimated regression equation. Various tests are then employed to determine if the model is satisfactory. If the model is deemed satisfactory, the estimated regression equation can be used to predict the value of the dependent variable given values for the independent variables.
Regression model.
In simple linear regression, the model used to describe the relationship between a single dependent variable y and a single independent variable x is y = a0 + a1x + k. a0and a1 are referred to as the model parameters, and is a probabilistic error term that accounts for the variability in y that cannot be explained by the linear relationship with x. If the error term were not present, the model would be deterministic; in that case, knowledge of the value of x would be sufficient to determine the value of y.
Least squares method.
Either a simple or multiple regression model is initially posed as a hypothesis concerning the relationship among the dependent and independent variables. The least squares method is the most widely used procedure for developing estimates of the model parameters.
As an illustration of regression analysis and the least squares method, suppose a university medical centre is investigating the relationship between stress and blood pressure. Assume that both a stress test score and a blood pressure reading have been recorded for a sample of 20 patients. The data are shown graphically in the figure below, called a scatter diagram. Values of the independent variable, stress test score, are given on the horizontal axis, and values of the dependent variable, blood pressure, are shown on the vertical axis. The line passing through the data points is the graph of the estimated regression equation: y = 42.3 + 0.49x. The parameter estimates, b0 = 42.3 and b1 = 0.49, were obtained using the least squares method.
Correlation.
Correlation and regression analysis are related in the sense that both deal with relationships among variables. The correlation coefficient is a measure of linear association between two variables. Values of the correlation coefficient are always between -1 and +1. A correlation coefficient of +1 indicates that two variables are perfectly related in a positive linear sense, a correlation coefficient of -1 indicates that two variables are perfectly related in a negative linear sense, and a correlation coefficient of 0 indicates that there is no linear relationship between the two variables. For simple linear regression, the sample correlation coefficient is the square root of the coefficient of determination, with the sign of the correlation coefficient being the same as the sign of b1, the coefficient of x1 in the estimated regression equation.
Neither regression nor correlation analyses can be interpreted as establishing cause-and-effect relationships. They can indicate only how or to what extent variables are associated with each other. The correlation coefficient measures only the degree of linear association between two variables. Any conclusions about a cause-and-effect relationship must be based on the judgment of the analyst.
4b) Calculate Karl Pearson’s coefficient of correlation between X series and Y series.
x
110
120
130
120
140
135
155
160
165
155
y
12
18
20
15
25
30
35
20
25
10
X
Y
X2
Y2
XY
110
12
12100
144
1320
120
18
14400
324
2160
130
20
16900
400
2600
120
15
14400
225
1800
140
25
19600
625
3500
135
30
18225
900
4050
155
35
24025
1225
5425
160
20
25600
400
3200
165
25
27225
625
4125
155
10
24025
100
1550
∑X= 1390
∑Y=210
∑X2 =196500
∑Y2=4968
∑XY= 29730
r = N ∑XY – ∑X∑Y/SQ Root of [N∑X2 –(∑X)2] [N∑Y2 –(∑Y)2]
= 10(29730) – (1390)(210)/SQ Root of [10(196500)- (1390) 2] [10(4968)- (210)2]
= 297300- 291900/SQ Root of[1965000-1932100] [49680- 44100]
= 5400/SQ Root of[32900] [5580]
= 5400/13549.2435
= 0.39
5. Briefly explain the methods and theories of Business forecasting.
MEANING OF BUSINESS FORECASTING
A planning tool that helps management in its attempts to cope with the uncertainty of the future, relying mainly on data from the past and present and analysis of trends.
Forecasting starts with certain assumptions based on the management's experience, knowledge, and judgment. These estimates are projected into the coming months or years using one or more techniques such as Box-Jenkins models, Delphi method, exponential smoothing, moving averages, regression analysis, and trend projection.
Methods of business forecasting
Scenario Writing
In Scenario Writing, the forecaster generates different outcomes based on different starting criteria.
Subjective Approach
Subjective forecasting allows forecasters to predict outcomes based on their subjective thoughts and feelings
Time-Series Forecasting
Time-series forecasting is a quantitative forecasting technique. It measures data gathered over time to identify trends.
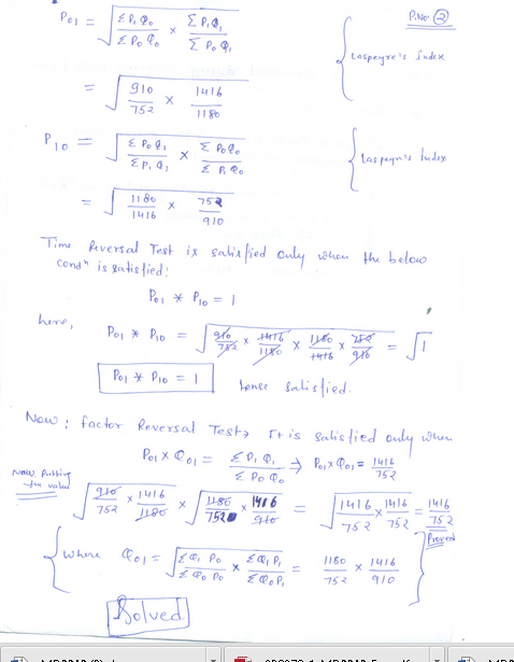
6.Construct Fisher’s Ideal Index for the given information and check whether Fisher’s formula satisfies Time Reversal and Factor Reversal Tests.
Items
P0
Q0
P1
Q1
A
16
5
20
6
B
12
10
18
12
C
14
8
16
10
D
20
6
22
10
E
80
3
90
5
F
40
2
50
5
Formula of Fishers Ideal Index
Computation of Fisher’s Ideal Index
Fisher’s formula satisfies Time Reversal Test
Fisher’s formula satisfies Factor Reversal Test
Answer
This method is a combination of Laspeyre’s and Paasche’s method. If we find out the geometric average of Laspeyre’s index and Paasche’s index, we get the index suggested by Fisher. Fisher’s index number is given by:
असाइनमेंट्स के लिए कॉल करे 8400000606 या e-mail करें [email protected]
BY SIR MAHAVEER SINGH BHARDWAJ
MB0040 STATISTICS FOR MANAGEMENT
Clasification VS Tabulation
Both classification and tabulation are methods of summarizing data in statistics, which makes further analysis of data to draw inferences from the data. In this article, we will discuss in detail the two methods of summarizing the data and distinguish between classification and tabulation of data.
What is Classification of Data?
In statistics, classification is the process of separation of data into several classes or groups using properties in the data set. For example, the mathematics test results of a class can be separated into two groups using gender. Such a classification condenses the raw data into suitable forms for statistical analysis and removes complex data patterns and highlights the core representatives of the raw data. After classification, comparisons can be made, and inferences can be drawn. Classified data can also provide relationships or correlative data patterns.
Raw data are classified using four key characteristics, such as geographical, chronological, qualitative, and quantitative properties. Consider a data set gathered for analysis of income of workers around the world. For example, the income of an average worker can be classified based on the country of the worker, where geographic factor is the metric for classification. It can also be classified based on the chronological properties such as age of the worker. The profession of each worker also provides a qualitative base for classification and the salary ranges can be used as a quantitative base for classification.
What is Tabulation of Data?
In statistics, tabulation is a method of summarizing data, using a systematic arrangement of data into rows and columns. Tabulation is carried out with the intention of carrying out investigation, for comparison, to identify errors and omissions in data, to study a prevailing trend, to simplify the raw data, to use the space economically and use it as future reference.
Generally a statistical table has following components.
Component
Description
What is the difference between Classification and Tabulation?
• In classification, data are separated and grouped based on a property of the data common to all values.
• In tabulation, data is arranged into columns and rows based on characteristics/properties, or indicators.
• Tabulation often emphasize on the presentation aspects of the data, while classification is used as a means of sorting of data for further analysis.
2 a) Describe the characteristics of Normal probability distribution.
The Normal Probability Distribution is very common in the field of statistics.
Whenever you measure things like people’s height, weight, salary, opinions or votes, the graph of the results is very often a normal curve.
The Normal Distribution
A random variable X whose distribution has the shape of a normal curve is called a normal random variable.
Question: In a sample of 120 workers in a factory, the mean and standard deviation of wages were Rs11.35 and Rs.3.03 respectively. Find the percentage of workers getting wages between Rs.9 and Rs.17 in the whole factory assuming that the wages are normally distributed
Answer :n = 120
μ = 11.35
σ = 3.03
percentage of workers getting wages between Rs.9 and Rs.17 in the whole factory assuming that the wages are normally distributed is :
= P( 9 ≤ X ≤ 17)
= P( [ 9 - μ ] / σ ≤ [X - μ] / σ ≤ [ 17 - μ ] / σ )
= P( [ 9-11.35 ] / 3.03 ≤ z ≤ [ 17-11.35 ] / 3.03 ) ; z = [X - μ ] / σ is the standard normal variable
= P(-0.776 ≤ z ≤ 1.865 )
= P(z ≤ 1.865 ) - P( z ≤ -0.776 )
= 0.96891 - 0.21887
= 0.75
= 75%(Ans)
3 a) The procedure of testing hypothesis requires a researcher to adopt several steps.
Describe in brief all such steps.
Answer : Five Steps of Hypothesis Testing
The basic logic of hypothesis testing is to prove or disprove the research question. By only allowing an error of 5% or 1% and making correct decisions based on statistical principles, the researcher can conclude that the result must be real if chance alone could produce the same result only 5% of the time or less. These five steps consists of
b) Distinguish between:
i. Stratified random sampling and Systematic sampling
Answer : Stratified Random Sampling
Stratified Random Sampling, also sometimes called proportional or quota random sampling, involves dividing your population into homogeneous subgroups and then taking a simple random sample in each subgroup. In more formal terms:
Objective: Divide the population into non-overlapping groups (i.e., strata) N1, N2, N3, … Ni, such that N1 + N2 + N3 + … + Ni = N. Then do a
ii. Judgement sampling and Convenience sampling
Answer : Judgmental sampling is a non-probability sampling technique where the researcher selects units to be sampled based on their knowledge and professional judgment.
Purposive sampling is used in cases where the specialty of an authority can select a more representative sample that can bring more
4 a) What is regression analysis? How does it differ from correlation analysis?
Regression and correlation analysis:
Regression analysis involves identifying the relationship between a dependent variable and one or more independent variables. A model of the relationship is hypothesized, and estimates of the parameter values are used to develop an estimated regression equation. Various tests are then employed to determine if the model is satisfactory. If the model is deemed satisfactory, the estimated regression equation can be used to predict the value of the dependent variable given values for the independent variables.
Regression model.
In simple linear regression, the model used to describe the relationship between a single dependent variable y and a single independent variable x is y = a0 + a1x + k. a0and a1 are referred to as the model parameters, and is a probabilistic error term that accounts for the variability in y that cannot be explained by the linear relationship with x. If the error term were not present, the model would be deterministic; in that case, knowledge of the value of x would be sufficient to determine the value of y.
Least squares method.
Either a simple or multiple regression model is initially posed as a hypothesis concerning the relationship among the dependent and independent variables. The least squares method is the most widely used procedure for developing estimates of the model parameters.
As an illustration of regression analysis and the least squares method, suppose a university medical centre is investigating the relationship between stress and blood pressure. Assume that both a stress test score and a blood pressure reading have been recorded for a sample of 20 patients. The data are shown graphically in the figure below, called a scatter diagram. Values of the independent variable, stress test score, are given on the horizontal axis, and values of the dependent variable, blood pressure, are shown on the vertical axis. The line passing through the data points is the graph of the estimated regression equation: y = 42.3 + 0.49x. The parameter estimates, b0 = 42.3 and b1 = 0.49, were obtained using the least squares method.
Correlation.
Correlation and regression analysis are related in the sense that both deal with relationships among variables. The correlation coefficient is a measure of linear association between two variables. Values of the correlation coefficient are always between -1 and +1. A correlation coefficient of +1 indicates that two variables are perfectly related in a positive linear sense, a correlation coefficient of -1 indicates that two variables are perfectly related in a negative linear sense, and a correlation coefficient of 0 indicates that there is no linear relationship between the two variables. For simple linear regression, the sample correlation coefficient is the square root of the coefficient of determination, with the sign of the correlation coefficient being the same as the sign of b1, the coefficient of x1 in the estimated regression equation.
Neither regression nor correlation analyses can be interpreted as establishing cause-and-effect relationships. They can indicate only how or to what extent variables are associated with each other. The correlation coefficient measures only the degree of linear association between two variables. Any conclusions about a cause-and-effect relationship must be based on the judgment of the analyst.
4b) Calculate Karl Pearson’s coefficient of correlation between X series and Y series.
x
110
120
130
120
140
135
155
160
165
155
y
12
18
20
15
25
30
35
20
25
10
X
Y
X2
Y2
XY
110
12
12100
144
1320
120
18
14400
324
2160
130
20
16900
400
2600
120
15
14400
225
1800
140
25
19600
625
3500
135
30
18225
900
4050
155
35
24025
1225
5425
160
20
25600
400
3200
165
25
27225
625
4125
155
10
24025
100
1550
∑X= 1390
∑Y=210
∑X2 =196500
∑Y2=4968
∑XY= 29730
r = N ∑XY – ∑X∑Y/SQ Root of [N∑X2 –(∑X)2] [N∑Y2 –(∑Y)2]
= 10(29730) – (1390)(210)/SQ Root of [10(196500)- (1390) 2] [10(4968)- (210)2]
= 297300- 291900/SQ Root of[1965000-1932100] [49680- 44100]
= 5400/SQ Root of[32900] [5580]
= 5400/13549.2435
= 0.39
5. Briefly explain the methods and theories of Business forecasting.
MEANING OF BUSINESS FORECASTING
A planning tool that helps management in its attempts to cope with the uncertainty of the future, relying mainly on data from the past and present and analysis of trends.
Forecasting starts with certain assumptions based on the management's experience, knowledge, and judgment. These estimates are projected into the coming months or years using one or more techniques such as Box-Jenkins models, Delphi method, exponential smoothing, moving averages, regression analysis, and trend projection.
Methods of business forecasting
Scenario Writing
In Scenario Writing, the forecaster generates different outcomes based on different starting criteria.
Subjective Approach
Subjective forecasting allows forecasters to predict outcomes based on their subjective thoughts and feelings
Time-Series Forecasting
Time-series forecasting is a quantitative forecasting technique. It measures data gathered over time to identify trends.
6.Construct Fisher’s Ideal Index for the given information and check whether Fisher’s formula satisfies Time Reversal and Factor Reversal Tests.
Items
P0
Q0
P1
Q1
A
16
5
20
6
B
12
10
18
12
C
14
8
16
10
D
20
6
22
10
E
80
3
90
5
F
40
2
50
5
Formula of Fishers Ideal Index
Computation of Fisher’s Ideal Index
Fisher’s formula satisfies Time Reversal Test
Fisher’s formula satisfies Factor Reversal Test
Answer
This method is a combination of Laspeyre’s and Paasche’s method. If we find out the geometric average of Laspeyre’s index and Paasche’s index, we get the index suggested by Fisher. Fisher’s index number is given by:
END OF ASSIGNMENT
-----------------------------------------------------------------------------------
MB0041 & FINANCIAL AND MANAGEMENT ACCOUNTING
======================================================================
1.Inventory in a business is valued at the end of an accounting period, at either cost or market price, whichever is lower. This is accepted convention or a practice in accounting.
Give a small introduction on accounting conventions and elucidate all the eight accounting conventions.
Definition of 'Accounting Convention'
Guidelines that arise from the practical application of accounting principles. An accounting convention is not a legally-binding practice; rather, it is a generally-accepted convention based on customs, and is designed to help accountants overcome practical problems that arise out of the preparation of financial statements. As customs change, so to will accounting conventions.
2. Eight ACOUNTING CONVENTIONS
1. Convention of income recognition
According to this concept, revenue is considered as being earned on the date on which it is realised, i.e., the date on which goods and services are transferred to customers for cash or for promise.
· A sale is considered to be made when the property in goods (ownership) is transferred from the seller to buyer.
· In case of services, revenue is said to be earned when the service has been delivered.
2. Convention of matching cost and revenue
According to this concept, revenue earned during a period is compared with the expenditure incurred to earn that income, irrespective of whether the expenditure is paid during that period or not. This is also called matching cost and revenue principle.
3. Convention of historical costs
This convention says that all transactions must be recorded at a value at which they were incurred. Such a value is called ‘Historical Cost’ and this principle is called the Convention of ‘Cost’. An asset or transaction may have many other values associated with it like market value or replacement cost. But all assets are recorded at the cost of acquisition and this cost is the basis for all subsequent accounting for the assets
4 .Convention of full disclosure
This convention requires a business to disclose the following:
· All the accounting policies adopted in the preparation and presentation of financial statements.
· If there is any change in the accounting policies in the current year as compared to the previous year/s, the effects of such changes and the reason/s thereof.
· The implications (in terms of money value) on the financial statements due to such change.
5. Convention of double aspect
This concept states that every transaction has two aspects. One is the receiving aspect and the other is the giving aspect. In accounting language, these two aspects are called ‘debit’ and ‘credit’.
The claims on assets will always be equal to the assets. The claims on assets may be of the owners or of the outsiders (creditors).
6 .Convention of materiality
This convention states that the benefit derived from measuring, recording, and processing a transaction should justify the cost of doing it.
7. Convention of consistency
This convention requires that the accounting policies must be consistently applied year after year. Consistency is required to help comparison of financial data from one period to another. Once a method of accounting is adopted, it should not be changed. A change in an accounting policy may be done only when:
· It is required by law
· It is felt that the new policy reflects the financial performance or position better than the old policy
8. Convention of conservatism or prudence
Accountants follow the rule “anticipate no profits but provide for all anticipated losses“. Whenever loss is anticipated, sufficient provisions should be made. But if a profit is anticipated, it should not be recorded until it is actually realized.
2.Analyse the following transactions according to traditional approach.
a. 1.1.2011 Sunitha started his business with cash Rs. 5,00,000
b. 2.1.2011 Borrowed from Malathi Rs. 5,00,000
c. 2.1.2011 Purchased furniture Rs. 1,00,000
d. 4.1.2011 Purchased furniture from Meenal on credit Rs. 1,50,000
e. 5.1.2011 Purchased goods for cash Rs. 50,000
f. 6.1.2011 Purchased goods from Ram on credit Rs. 2,50,000
g. 8.1.2011 Sold goods for cash Rs. 1,25,000
h. 8.1.2011 Sold goods to Shyam on credit Rs. 55,000
i. 9.1.2011 Received cash from Shyam Rs. 25,000
j. 10.1.2011 Paid cash to Ram Rs. 90,000
Answer :Transaction under Traditional Approach
Sl no.
Accounts Involved
Nature of Account
Affects
Debit/Credit
a
Cash a/c
Capital a/c
Real
Personal
Cash is coming in
Sunita is the giver
Debit
Credit
b
Cash a/c
Loan from Malathi
Real
Personal
Cash is coming in
Malathi is the giver
Debit
Credit
c
Furniture a/c
Cash a/c
Real
Real
Furniture is coming in
Cash is going out
Debit
Credit
d
Furniture a/c
Meenal a/c
Real
Personal
Furniture is coming in
Meenal is the giver
Debit
Credit
e
Purchase a/c
Cash a/c
Nominal
Real
Purchase is an expense
Cash is going out
Debit
Credit
f
Purchase a/c
Ram’s a/c
Nominal
Personal
Purchase is an expense
Ram is the giver
Debit
Credit
g
Cash a/c
Sales a/c
Real
Nominal
Cash is coming in
Sales is revenue
Debit
Credit
h
Shyam’s a/c
Sales a/c
Personal
Nominal
Shyam is the receiver
Sales is revenue
Debit
Credit
i
Cash a/c
Shyam’s a/c
Real
Personal
Cash is coming in
Shyam is the giver
Debit
Credit
j
Ram’s a/c
Cash a/c
Personal
Real
Ram is the receiver
Cash is going out
Debit
Credit
3.The following items are found in the trial balance of M/s Sharada Enterprise on 31st December, 2000.
Sundry Debtors Rs.160000
Bad Debts written off Rs 9000
Discount allowed to Debtors Rs. 1800
Reserve for Bad and doubtful Debts 31-12-1999 Rs. 16500
Reserve for discount on Debtors 31-12-1999 Rs. 3200
You are required to provide the bad and doubtful debts at 5% and for discount on debtors at 2%. Show the adjustments for bad debts, bad debts reserve, discount account, and provision for discount on debtors.
Answer: Solution:
The amount debited to P&L account towards RBD is computed as follows:
Old RBD = Rs. 16500
(-) Bad debts = Rs. 9000
Balance = Rs. 7500
New RBD @5% on160000 = Rs. 8000
RBD to be provided = Rs. 500 (8000-7500)
The amount debited to P&L account towards Reserve for Discount on Debtors is computed as follows:
Good Debtors = Rs.160000 – Rs.8000 (New RBD) = Rs.152000
Old Reserve for Discount on Drs = Rs.3200
Less Discount on Drs = Rs.1800
Balance Reserve = Rs.1400
New Reserve for Discount at 2% on good Drs 152000 = Rs.3040
Reserve for Discount to be provided now = Rs.1640 (3040 -1400)
In the balance sheet, the Sundry debtors are reduced by bad debts shown out side the trial balance, the new RBD, discount on debtors shown out side the trial balance and the new Reserve for discount on debtors.
4.The reports prepared in financial accounting are also used in the management accounting. But there are few major differences between financial accounting and management accounting.
Explain the differences between financial accounting and management accounting in various dimensions.
ANSWER: Financial accounting is the preparation and communication of financial information to outsiders such as creditors, bankers, government, customers, etc. Another objective of financial accounting is to give complete picture of the enterprise to shareholders. Management accounting on the other hand, aims at preparing and reporting the financial data to the management on regular basis. Management is entrusted with the responsibility of taking appropriate decisions, planning, performance evaluation, control, management of costs, cost determination, etc. For both financial accounting and management accounting the financial data are the same. The reports prepared in financial accounting are also used in management accounting. But there are a few major differences between financial accounting and management accounting.
Differences between the Financial and Management Accounting
Dimension
Financial accounting
Management accounting
Users
The primary users of financial accounting information are external users like shareholders, creditors, government authorities, employees, etc.
The primary users of management accounting are internal users like top, middle, and lower level managers.
Purpose
Reporting financial performance and financial position to enable the users to take financial decisions.
To help the management in planning, decision making, monitoring, and controlling.
Need
It is a statutory requirement. What to report, how to report, how much to report, when to report, in which form to report, etc. are stipulated by Law or Standards
It is optional. What to report, how to report, how much to report, when to report, in which form to report, etc. are decided by the management as per the needs of the company or management
Expression of information
Accounting information is always expressed in terms of money.
Management accounting may adopt any measurement unit like labour hours, machine hours, or product units for the purpose of analysis.
Reporting timing and frequency
Financial data is presented for a definite period, say one year or a quarter.
Reports are prepared on a continuous basis, monthly, weekly, or even daily
Time Perspective
Financial accounting focuses on historical data.
Management accounting is oriented towards the future
Sources of Principles
Financial accounting is a discipline by itself and has its own principles, policies and conventions (GAAP)
Management accounting makes use of other disciplines like economics, management, information system, operation research, etc.
Reporting Entity
Overall organisation
Responsibility centres within the organisation
Form of Reports
Income statement (Profit and Loss a/c)
MIS reports
Balance sheet
Performance reports
Cash flow statement
Control reports
Cost statements
Variance statements
Budgets
Estimate statements
Flowcharts
5.Draw the Balance Sheet for the following information provided by Sandeep Ltd..
a. Current Ratio : 2.50
b. Liquidity Ratio : 1.50
c. Net Working Capital : Rs.300000
d. Stock Turnover Ratio : 6 times
e. Ratio of Gross Profit to Sales : 20%
f. Fixed Asset Turnover Ratio : 2 times
g. Average Debt collection period : 2 months
h. Fixed Assets to Net Worth : 0.80
i. Reserve and Surplus to Capital : 0.50
Answer:
Balance Sheet
Liabilities
RS
Assets
RS
Capital
500000
Fixed Assets
600000
Reserves and Surplus
250000
Inventories
200000
Long term Debt
150000
Debtors
250000
Current Liabilities
200000
Bank
50000
Total
1100000
Total
1100000
Working Notes
If Current Liabilities =1
Current Assets = 2.5
Working Capital (2.5 -1) = 1.5
= 300000
Therefore Current Assets (2.5/1.5) x 300000
= 500000
Current Liabilities (1/1.5) x 300000
= 200000
Liquidity Ratio = 1.5
Current Liabilities = 200000
Therefore Liquid Asset (200000 x 1.5)
=300000
Inventories (Current asset – Liquid asset)
=200000
Stock Turnover Ratio = 6 times
= 1200000
Cost of sales (6 x 200000)
Gross Profit Ratio = 20%
Gross Profit
If Sales is 100; Gross Profit is 20
Hence cost of sales is (100-20) = 80
Therefore Gross Profit is (20/80) x 1200000
= 300000
Sales ( Cost of Sales + Gross Profit)
=1500000
Fixed Asset Turnover ratio = 2 times
(Cost of sales/Fixed assets)
Therefore Fixed Assets (1200000/2)
= 600000
Debtor’s Collection Period = 2 months
(Months in a year /Debtor’s turnover)
Debtor’s Turnover Ratio (12/2) = 6 times
(Sales/ Debtors)
Debtors (1500000/6)
= 250000
Fixed Assets to Shareholders’ Net worth = 0.80
Share holders’ Net worth(600000/0.80)
=750000
Reserves and Surplus to Capital = 0.50
If capital is 1: reserves and Surplus is 0.5
Reserves and Surplus + Capital = Shareholder’s Net worth
(0.5 +1 =1.5)
Reserves and Surplus (7500000 x(0.5/1.5)
=250000
Therefore share Capital
=500000
6.Write the main differences between cash flow analysis and fund flow analysis.
Following is the balance sheet for the period ending 31st March 2011 and 2012. If the current year’s net loss is Rs.38,000, Calculate the cash flow from operating activities. 31st MARCH
2011
2012
Short-term loan to employees
15,000
18,000
Creditors
30,000
8,000
Provision for doubtful debts
1,200
-
Answer: Differences Between Cash Flow Analysis and Fund Flow Analysis
Cash Flow Analysis
Fund Flow Analysis
1. It is concerned only with the change in cash position
1. It is concerned with change in working capital position between two balance sheet dates
2. It is merely a record of cash receipts and disbursements
2. Net effect of receipts and disbursements are recorded
3. Cash is part of working capital and therefore an improvement in cash position results improvement in the funds position
3. An improvement in funds positions need not result in improvement in cash position
4. It is cash based
4. It is accrual based
Statement of cash flow from operating activities
Statement Showing Cash Flow from Operating Activities
Net Loss
-38000
Add: Decrease in current assets
Decrease in stock
2000
Decrease in prepaid expenses
200
Increase in current liabilities
Increase in outstanding expenses
200
Increase in bills payable
2000
+4400
-33600
Less: Increase in current assets
Increase in short-term loan to the employees
3000
Increase in bills receivable
10000
Decrease in creditors
22000
Decrease in provision for doubtful debts 1,200
1200
-36000
Net cash lost in operating activities
-69800
===================================================================
END OF ASSIGHNMENT
MORE ASSIGNMENT TO BE UPLOADED.....
